Conversation Logs
Browse, filter, and review user conversations with audit details, caller type filtering, and false positive marking
Conversation Logs give you a complete view of every interaction between users — and service integrations — and the AI assistant. Browse conversations, filter by channel, caller type, or confidence, review audit details for individual messages, and flag guardrail triggers as false positives. The page is reachable from the Log item in the main navigation.
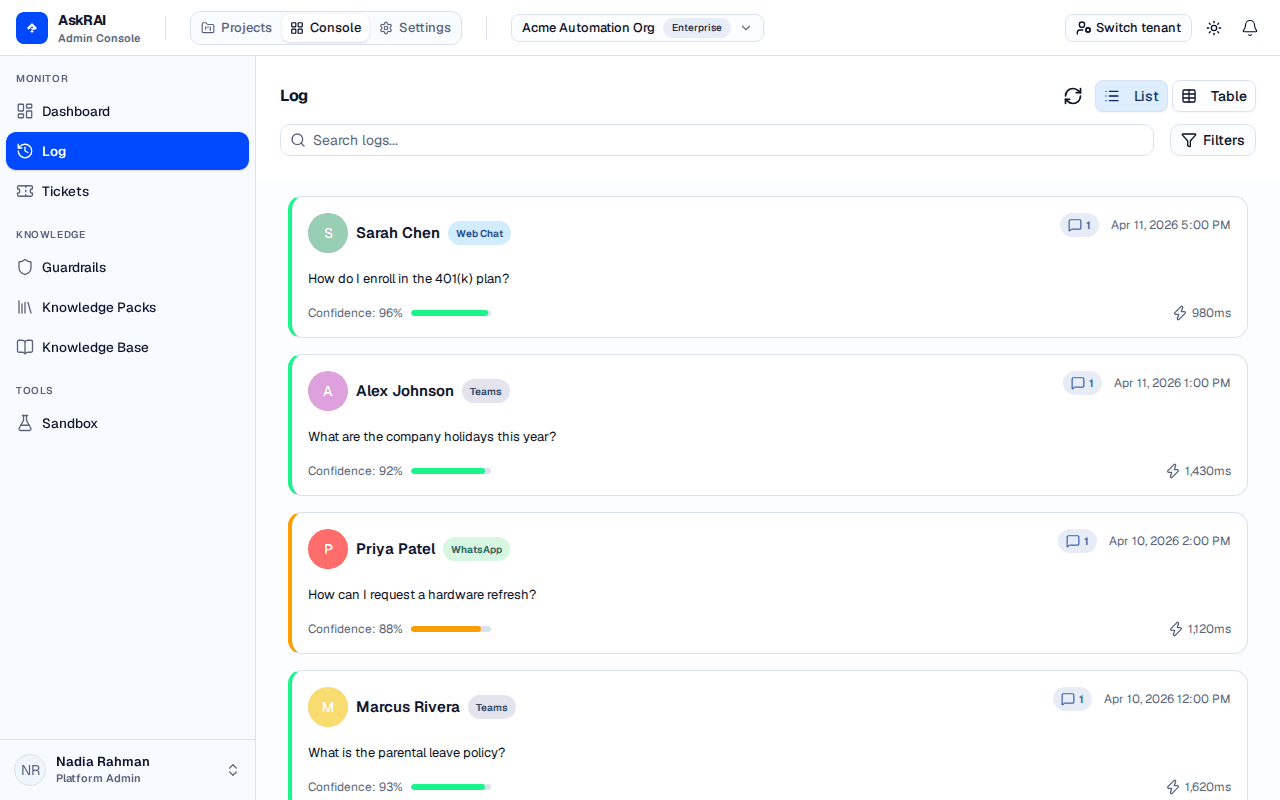
One card is a whole conversation, not a single question. Every summary figure on it — message count, confidence, response time, the preview text — describes only the turns that match your current filters, not the whole thread.
Browsing conversations
The page header carries a List / Table view toggle. The page opens in List view, which renders each conversation as a card; Table view renders the same conversations as rows and is the only view with sort controls.
List view
Each conversation card displays:
| Element | Description |
|---|---|
| User avatar and name | The user or credential that started the conversation |
| Channel badge | The interface or messaging channel (Web Chat, Teams, API, MCP, and more) |
| Message count | Number of messages in the conversation thread |
| Timestamp | When the conversation occurred |
| Question text | The user's query |
| Confidence score | AI confidence as a percentage with a color-coded progress bar |
| Response time | Processing time in milliseconds |
A Refresh button beside the filters re-runs the current query — the page loads once and does not poll, so this is how you pick up conversations that arrived since.
Click any card to open the details drawer on the right side of the page. Every card carries a coloured left border already — that is its confidence band — so the selected one is marked differently, with a tinted background and a ring around it.
Table view
Switch the header toggle to Table to see the same conversations as a sortable table:
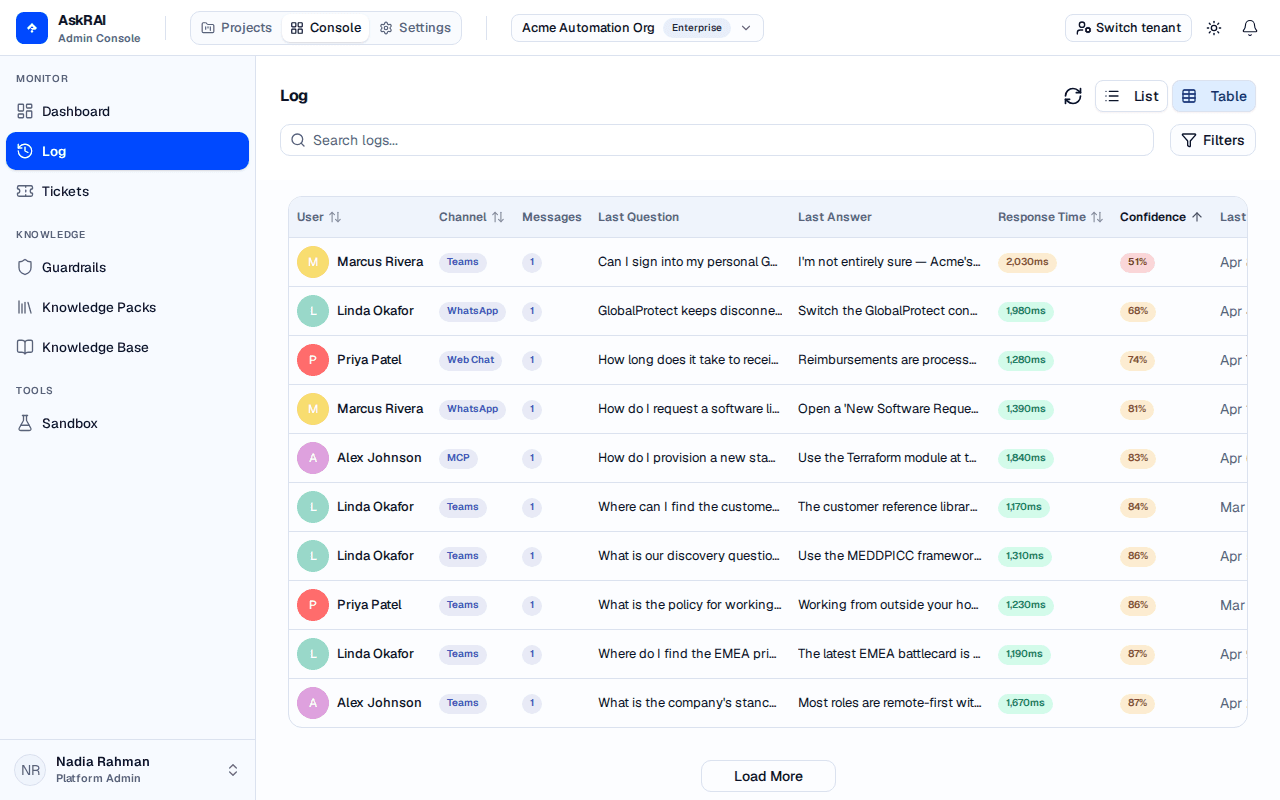
Table view adds the Last Answer column and the sortable column headers; the active sort column shows a single arrow.
| Column | Description | Sortable |
|---|---|---|
| User | The user or credential that started the conversation | Yes |
| Channel | The interface or messaging channel | Yes |
| Messages | Number of messages in the conversation thread | No |
| Last Question | The most recent user query in the thread | No |
| Last Answer | The most recent AI answer in the thread | No |
| Response Time | Processing time in milliseconds | Yes |
| Confidence | AI confidence as a percentage | Yes |
| Last Activity | Date and time of the most recent message | Yes |
Last Answer appears only in Table view — the conversation cards do not show it. Clicking a row opens the same details drawer as clicking a card.
The view mode is not persisted. It is in-memory state only and is never written to the URL, so the page returns to List view on a full page reload, and it opens in List view for anyone you send a filtered URL to — they will not see the Last Answer column or the sort controls until they switch to Table view themselves. The filters and the sort in the URL still apply.
Loading more conversations
The list loads 10 conversations at a time. A Load More button below the list (or table) fetches the next 10. Paging is cursor-based, so changing a filter or a sort restarts the list from the top. The message thread inside the details drawer pages the same way, through a Load More Messages button at the bottom of the thread.
Filtering and search
Search
Use the search bar at the top to find conversations by user name, question text, answer text, or session ID. Search is debounced — results refresh roughly half a second after you stop typing.
Advanced filters
Click Filters to open the advanced filters popover. It holds five controls — Channel, Caller Type, Response Time (seconds), Confidence Level (%), and Show false positives only — which you can combine without leaving the page. Search is a separate control in the page header, and the page has no date-range filter.
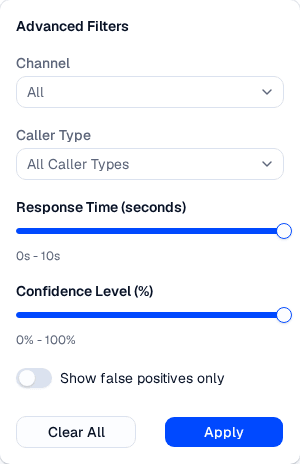
Every filter set here is written into the page URL, so a filtered view can be shared with a colleague as a link.
| Filter | Options | Purpose |
|---|---|---|
| Channel | Web Chat, Mobile App, Teams, WhatsApp, SMS, Phone, Email, API, CLI, MCP, or All | Restrict conversations to a single messaging or integration channel |
| Caller Type | Human, Application, Agent, or All Caller Types | Restrict to conversations produced by a specific caller class |
| Response Time | 0–10 seconds (slider) | Cap the maximum response time shown — always applied when you press Apply (see the warning below) |
| Confidence Level | 0–100% (slider) | Cap the maximum confidence score shown; at the 100% ceiling no confidence bound is applied |
| Show false positives only | Toggle | Show only conversations that contain at least one guardrail result flagged as a false positive |
Active filters appear as chips below the search bar. Click the X on any chip to remove that filter.
Apply commits the draft selections in the popover and closes it.
Clear All immediately resets the five filters owned by the popover (Channel, Caller Type, Response Time, Confidence Level, False Positives Only) — their chips disappear and the query re-runs at once, so you do not need to press Apply afterwards — and the popover stays open so you can pick a new filter. It does not clear the search box or the current sort.
Pressing Apply always commits a response-time cap. Leaving the Response Time slider at its 10 s ceiling still filters out every conversation that took longer than 10 seconds, and a "Response Time: Less than 10s" chip appears below the search bar. To remove the cap, drag the slider to 0 s, delete the chip, or press Clear All. Reopening the popover shows the slider at 10 s whether or not a cap is applied, so the chip is the only reliable indication that a response-time cap is active. The Confidence Level slider does not behave this way — at its 100% ceiling no confidence bound is applied.
False Positives Only keeps just the conversations that contain at least one guardrail result a reviewer has flagged as a false positive. One subtlety to expect, and it is not specific to this toggle: every summary figure on a card describes only the turns matching your current filters, because the filter is applied before the conversation is grouped. With this toggle on, a row can read "1 message" though the thread has more; the search box and both sliders narrow the same figures the same way. The details drawer is deliberately unfiltered and still shows the whole thread. To see how often a specific guardrail has been flagged across all conversations, use the per-guardrail false-positive rate on the Guardrails page.
The Caller Type filter is most useful when combined with the Channel filter. For example, selecting MCP channel and Agent caller type isolates traffic from AI agents connected through the MCP server — a common first step when investigating an automation issue.
Channel reference
The Channel filter includes every interface that can produce a conversation, not just the traditional human-facing channels. This makes it possible to investigate programmable traffic directly from the log view:
| Channel | Origin |
|---|---|
| Web Chat | Reserved for the embeddable web widget, which is not shipped yet. The Sandbox simulates this channel |
| Mobile App | Reserved for a native mobile SDK, which is not shipped yet |
| Teams | Microsoft Teams bot |
| WhatsApp Business integration | |
| SMS | SMS gateway |
| Phone | Voice channel |
| Email-to-ticket integration | |
| API | Direct calls to the public API with a credential |
| CLI | Requests issued through the askrai command-line client |
| MCP | Calls from an AI agent through the MCP server |
Caller Type reference
Caller Type describes who produced the request. It is declared by the credential the request was made with, so only programmable traffic carries one:
| Caller Type | Description |
|---|---|
| Human | A person calling through the API, CLI or MCP with a credential issued to a person |
| Application | A back-office service or automation calling with a service credential |
| Agent | An AI agent calling through MCP or the API with an agent credential |
| (none) | Traditional-channel traffic — Teams, Web Chat and the rest — which declares no caller type |
Human does not mean "a person asked this". A question typed into Teams or Web Chat carries no caller type at all, so filtering on Human narrows the list to credential-issued traffic and hides every conversation from your traditional channels. The Caller Type chart on the dashboard counts the same way.
Filters are persisted in the URL as query parameters. Share the URL with a teammate to give them the same filtered view.
Sorting
Sorting is performed in the Table view, reached through the List/Table toggle in the page header — the page opens in List view, and the card list has no sort control. In Table view, click a sortable column header — User, Channel, Response Time, Confidence, or Last Activity — to sort by it. Clicking the active column flips its direction; clicking a new column starts it ascending. The active column is announced to assistive technology through aria-sort. The default sort is Last Activity descending (newest first).
The sort itself is not tied to the view: it is sent to the API in both views and persists in the URL (sortField and sortDirection), so a sort chosen in Table view still orders the cards after you switch back to List. Only the control is missing from List view.
Conversation details
Click a conversation card to open the details drawer with two tabs: Overview and Audit.
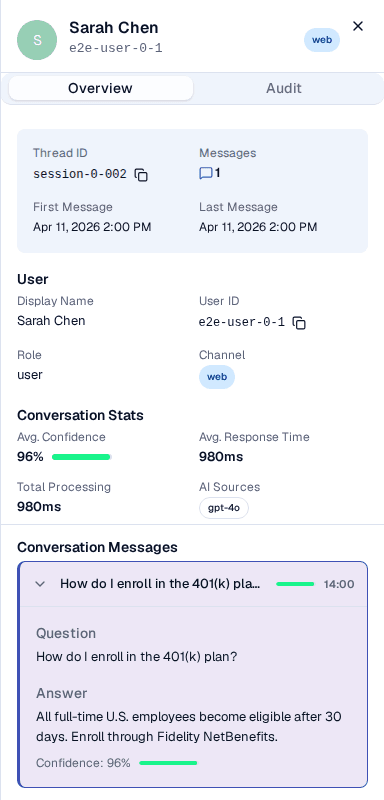
This drawer is also where a guardrail trigger is marked a false positive, which is what feeds the per-guardrail false-positive rate on the guardrail analytics.
Overview tab
The Overview tab displays:
- Thread info — thread ID (copyable), message count, first and last message timestamps
- User info — display name, user ID (copyable), role, and channel — or credential name and caller type for programmable traffic
- Conversation stats — average confidence, average response time, total processing time, and AI sources used
Audit tab
Select a message in the conversation thread (listed below the tabs) to view its audit record. The Audit tab opens with a stat grid — Audit ID (copyable), Timestamp, Response Time, AI Source, and Execution Mode (shown only when recorded) — followed by these sections:
Model — how the message was routed and which models answered it:
| Stat | Description |
|---|---|
| Routing Source | How the model was chosen. Reads Not configured when a source was recorded but nothing routed the query, and Not recorded when the audit carries no routing metadata at all — two different diagnoses |
| Summarization | The model used for the summarization stage — the model the request actually ran on, otherwise the configured model, else Not recorded |
| Matched Rule | The routing rule that matched; labelled Primary Rule when more than one rule contributed to the decision |
| Extra Details | A collapsible panel — rendered only when there is something to show — listing the per-stage contributing rules, the Refinement model, the Guardrail model, and the Complexity tier |
AI Confidence — the confidence score as a percentage with a color-coded progress bar. If the response also has a vector confidence score (the similarity of the best match retrieval found), it is displayed separately. A Degraded chip appears beneath the bars when the answer's low score records a retrieval failure rather than a knowledge gap — the knowledge base could not be searched at all. Treat that as a platform fault to investigate, not as missing content to author.
Nearest Knowledge Base Match — when the confidence score is below the medium threshold, this section shows the closest matching question and answer from the knowledge base.
Governance — compliance status (Compliant, Not compliant, or Not checked), checked timestamp, reasoning, and per-guardrail results. Each guardrail result shows its compliance status, guardrail ID, and reasoning.
Escalation — the confidence band (High, Medium, or Low), whether the conversation was escalated, the escalation reason, and — when a ticket was created — the ticket ID as a copyable value (a truncated monospace string with a Copy button). The ticket ID itself is not a link; a separate View ticket button below it closes the drawer and opens the Tickets page with the ticket ID pre-filled in the search box, which resolves to that single ticket.
Click any message in the conversation thread to switch the Audit tab to that message's audit record. By default, the tab shows the most recent message.
False positive marking
When a guardrail evaluation produces an incorrect result — for example, flagging safe content as non-compliant — you can mark it as a false positive. Flagging records a review annotation on that single guardrail result (who flagged it, when, and an optional reason) and feeds the per-guardrail false-positive-rate metric on the Guardrails page.
Flagging a false positive is an annotation, not a correction. It does not change the audit's compliance status, and it does not lower the Block Rate on the Dashboard — the block rate counts audits whose compliance is false and is blind to the flag. It also cannot undo an escalation or close a ticket that was already created: escalation rules are evaluated once, when the audit event is ingested, and they match on the response's confidence band — a guardrail result never triggers an escalation in the first place. To stop a guardrail producing bad results, edit the guardrail itself.
Open the Conversation Details
Click a conversation card to open the details drawer, then switch to the Audit tab.
Find the Guardrail Result
In the Governance section, locate the guardrail result you want to flag. Each guardrail row shows its compliance status and a flag icon.
Flag as False Positive
Click the flag icon next to the guardrail result. A confirmation dialog appears where you can optionally enter a reason for the flag.
Confirm
Click Flag as False Positive to save. An orange "False Positive" chip appears next to the guardrail result to indicate it has been flagged.
To remove a false positive flag, click the orange flag icon on a flagged guardrail and confirm the removal.
False positive flags are per-guardrail, per-message. Flagging one guardrail result does not affect other guardrails in the same conversation or other conversations.
Field reference
Conversation card fields
| Field | Description |
|---|---|
| Display Name | The user or credential that issued the request |
| Channel | Interface or messaging channel (Web Chat, Teams, API, MCP, …) |
| Messages | Count of messages in the conversation thread |
| Timestamp | Date and time of the conversation (format: MMM D, YYYY h:mm A) |
| Question | The user's query text |
| Confidence | AI confidence score as a percentage (0–100%) |
| Response Time | Total processing time in milliseconds |
Audit record fields
| Field | Description |
|---|---|
| Audit ID | Unique identifier for the audit record (copyable) |
| Timestamp | Date and time of the audited message (format: MMM D, YYYY h:mm:ss A) |
| AI Confidence | Confidence score from the AI model (0–100%) |
| Vector confidence | How closely the best knowledge base match scored against the question, when retrieval returned one |
| AI Source | The source that produced the answer |
| Execution Mode | How the response was executed (shown only when recorded) |
| Compliance Status | Whether the response passed all guardrail checks |
| Escalated | Whether the conversation triggered an escalation rule |
| Ticket ID | Identifier of the created ticket (if escalated) — copyable, with a View ticket button that opens it on the Tickets page |
| Processing Time | Time taken to generate the response (milliseconds) |
| Caller Type | Human, Application, or Agent |
Related pages
- Dashboard — view aggregated confidence, caller type, and interface metrics
- Tickets — manage tickets created by escalation rules
- Guardrails — configure the guardrails evaluated in audit records
- Programmable Access — manage the service credentials that appear as API, CLI, and MCP conversations
- Confidence Thresholds — adjust the bands that drive the confidence filter